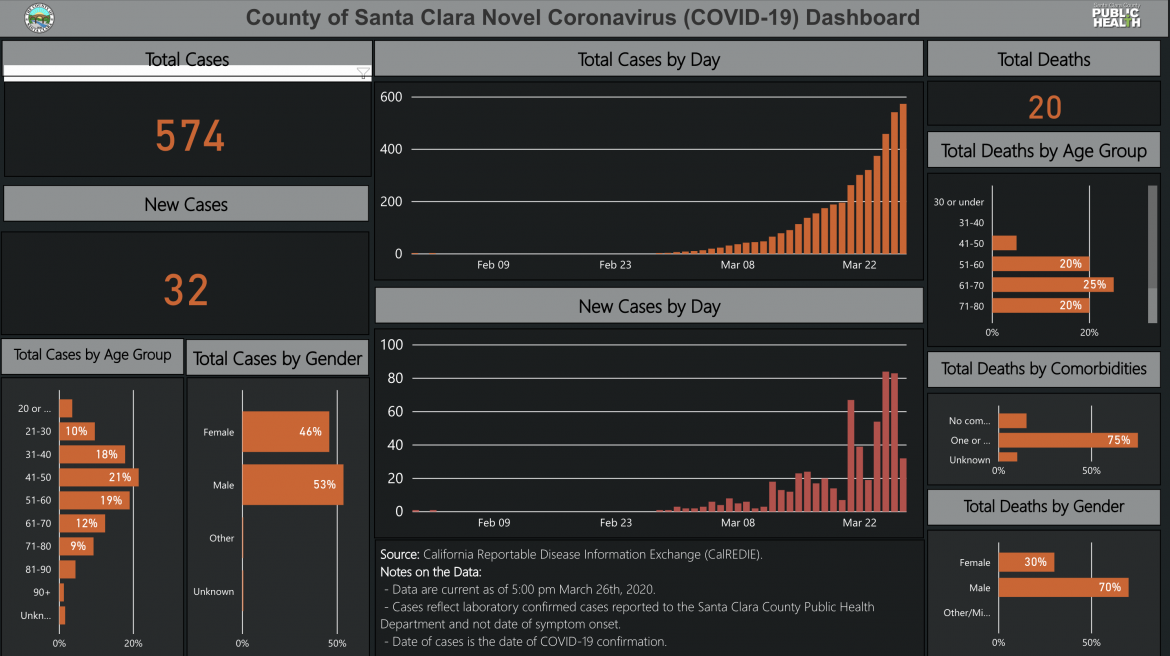
The Santa Clara County Public Health Department reported 32 new cases of COVID-19 on Friday, bringing the grand total of infected individuals up to 574 since the virus began spreading through Silicon Valley in late January. One more person has died from the respiratory infection as well, bringing the countywide death toll up to 20.
Public health officials unveiled the latest count on a new dashboard—part of an effort by the county to be more transparent about its pandemic response.
The data show that 41-to-50-year-olds make up 21 percent of the total tally, while 61-to-70-year-olds account for the largest number of deaths at 25 percent.
Some 75 percent of the individuals who have died had one or more pre-existing condition that put them at higher risk. More men than women have succumbed to the illness, a metric that tracks with global reports of the death toll. The new dashboard, however, does not track the number of hospitalizations, despite the county’s efforts to previously report out that data.
Information about how many tests have been conducted, however, was conspicuously absent on the new data portal. As of March 22, the county’s lab had only processed tests for 647 individuals. Despite signing off on a new mandate Tuesday that would require private labs like Verily and Quest Diagnostics to report how many each has conducted, a spokesperson for the health department said on Friday that the updated number of tests was not yet readily available.
The low volume of tests being conducted has hindered the ability of public officials to get a true picture of the scope of the outbreak. Santa Clara County and the city of San Jose have had different projections to the actual number of cases and predicted death tolls.
Earlier this week, San Jose Deputy City Manager Kip Harkness said anywhere from 2,000 to 16,000 people could die from COVID-19 in the county of nearly 2 million people. But in a statement given Thursday afternoon to reporters, county officials questioned the numbers, saying they hadn’t had a chance to review the methodology.
“The model shared by the city of San Jose projecting deaths and future case counts of COVID-19 was not produced, reviewed, or vetted by the County of Santa Clara,” the agency’s communications team said. “The County of Santa Clara continues to actively assess the situation and take necessary actions to slow the spread of the novel coronavirus in our community and protect those most at risk for severe illness.”


Some interesting information on COVID-19 testing.
https://www.healthpolicy-watch.org/new-covid-19-rapid-test-approved-for-genexpert-tb-platform-could-pave-way-for-more-testing-in-low-middle-income-countries/
“New COVID-19 Rapid Diagnostic Approved On ‘GeneXpert’ TB Platform; Could Pave Way For More Testing In Low- & Middle-Income Countries”
A company named Cepheid makes a commonly used family of “low-end” machines called “GeneXpert”..
There are roughly 5,000 GeneXpert machines in the U.S., but there are also other types of machines used for testng.
Machines come in different sizes with 1, 2, 4, 8 ,16 or more automated testing station.
A test is conducted by a technician who puts a sample in a cartridge, and loads the cartridge into a testing station.
The GeneXpert machine seems to sell for about $17,000 per testing station.
The single-use cartridges contain consumable reagents and sell for about $20 each.
A test can be done in about 45 minutes. It appears that some tests can occur faster and a testing station may be able to do 96 tests per day (4 per hour).
> Public health officials unveiled the latest count on a new dashboard—part of an effort by the county to be more transparent about its pandemic response.
The dashboard is interesting and probably saves a lot of people a lot of time answering questions.
NOW, we need a dashboard on outcomes.
We need to see a bargraph (“histograph”) of status of cases by day since diagnosis.
It needs to show “active” cases and “closed” or “recovered” cases.
It is important to know how the population of “active” cases is growing or declining, and the “time to recovery” for a COVID-19 infection.
If the population of “ACTIVE” cases is stable or declining, than all the isolations, quarantines, sheltering and lockdowns are arguably working.