
San José Mayor Sam Liccardo and San José Clean Energy on Thursday announced a major accomplishment in San José’s efforts to combat the effects of climate change.
San Jose Clean Energy, the community choice energy provider for 350,000 homes and businesses in San José, has achieved a 95% carbon-free electricity mix of solar, wind and hydroelectric power, and is the cleanest electricity mix out of the 10 largest cities in the U.S.
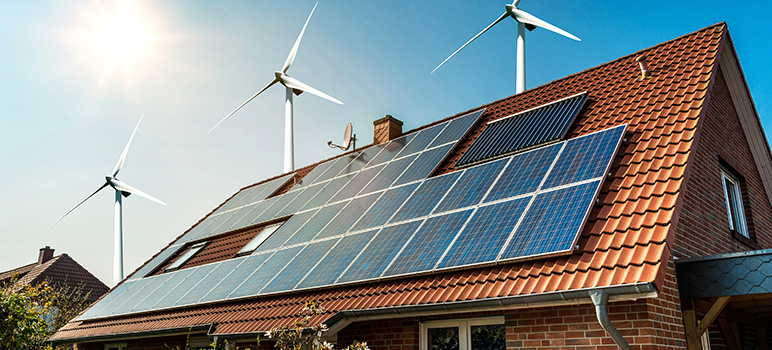
Renewable sources like solar and wind comprise 60% of Clean Energy’s power mix, up from 45% in 2019.
“San José continues to lead the nation through innovative solutions in our fight against climate change,” said Liccardo in a statement.. “SJCE’s clean power mix is just one of the bold actions we are taking to create a sustainable future for generations to come.”
Increasing the amount of renewable and carbon-free energy powering San José is a key component of Climate Smart San José, the city’s climate action plan. In November 2021, the city council pledged to reach net-zero greenhouse gas emissions by 2030
“San José Clean Energy is proud to play this foundational role on San José’s path to a carbon-neutral, clean energy future,”said Lori Mitchell, Director of the Community Energy Department, which operates the utility. “Our clean electricity is electrifying transportation, homes, and businesses and will improve the health of our community and planet.”
To date, Clean Energy has invested more than $1 billion to add new solar, wind, and battery storage to the grid at cost-effective prices for customers. In February 2022, Liccardo announced the completion of a new 62 megawatt (MW) solar generation and energy storage facility in Kern County that is delivering clean, pollution-free electricity daily from 6am. to 10pm for San José homes and businesses for the next 12 years. This builds on a 225 MW wind farm in New Mexico produced from 117 wind turbines that deliver enough clean electricity to power 186,000 San José homes.
As of Spring 2022, private automobiles and transportation-related carbon emissions account for more than 50% of the city’s greenhouse gas emissions. In light of this, San José remains the city with the single highest number of electric vehicle chargers, at a rate three times the national average.
Across San José, 97%, or 1,647 chargers, are public and 52, or 3%, are private-facing chargers. With 4% of all registered vehicles in the city being fully-electric or plug-in hybrids as of 2020, San José is the city with the third-highest adoption of electric vehicles in the nation with nearly 75,000 electric vehicles on the road nationwide.
The progress on closing the disproportionate impact of the transportation sector on San José’s emissions aligns with the city’s carbon-neutral goal, city officials said. San José is the largest city in the U.S. to have set a goal of carbon neutrality by 2030 and is making strides toward reducing its citywide greenhouse gas emissions.
Now that you are happy…
Why don’t you inform the public how much of their taxpayer dollars were wasted on the ‘Fuel Cell’ you and Mayor Reed supported as part of the ‘Green Vision’.
In case you forgot where the ‘Fuel Cell’ is located…take a trip out to the Water Pollution Control Plant (WPCP).
Don’t forget to tell everyone if the ‘Fuel Cell’ is still being used.
I warned the City many, many times not to pursue this boondoggle but…’The Green Vision’ was really about passing some ‘Green’ into contractor pockets and ‘political correctness banks’ for future uses.
David S. Wall
So will a person that claims to be a journalist or reporter add some context to this “major accomplishment”?
or do we just take the “smoke & mirrors” claims put forth by the City of San Jose as some major achievement?
350,000 homes – what percentage of the total housing stock in San Jose is this?
San Jose population was around 1.01 million in 2020.
Kern county is in SOCAL – how much land does the 62MW rated power plant use? What is the efficiency factor for this plant vs footprint (land vs infrastructure – concrete, solar cells, transmission cables and associated electrical components)?
Solar generation plants are about 20% efficient – so really about 12-15MW of useful output per day.
The rule of thumb for typical fossil fuel plant is 1MW can support 750 homes (this drops for wind & solar due to intermittent generation) – so Kern plant supports maybe 11,000 homes.
A wind farm in New Mexico? What is the footprint vs power generation? A lot of concrete and associated cabling goes into Wind Farms. Onshore wind generation is about 15% to 30% efficient – so best case for a 225MW rated plant is 67MW generated. So another 50,000 homes in Northern CA powered by a Wind Farm in the State of New Mexico.
Saying this Wind Farm can power 186,000 San Jose homes is very misleading – it may power that number of homes on a very windy day for the number of hours the wind is strong.
The electricity demand per household will increase with added EV charging needs – potentially dropping the homes per MW by over 50% – a need for more land & infrastructure to generate the extra capacity needs.
There will also need to be ‘Excess Capacity’ designed into the system to meet Peak Demand days when everyone is using more electricity to Cool or Heat homes,
Or do we just say we want to live with more blackouts – like in a 3rd world country – where the power goes out several times a day.
How is this scalable for the entire state of CA?, let alone the entire U.S.A.? or North America?
The only real solution is a diverse mix of energy sources to include fossil fuels (natural gas is abundant, very clean burning, small footprint, and available 24 hrs per day) and the much more dependable, greener, smaller footprint of nuclear power.
Look at the output capacity /efficiency factor for power generation:
Nuclear – 90% – Most Reliable
Natural Gas – 50% – 65%
Coal – ~ 64%
Geothermal – 73%
Hydro – Seasonal & Climate (in drought capacity is reduced)
Wind – 15% – 30% Onshore, Off-Shore Wind ~45%
Solar – 20%
Combine the efficiency factors with the footprint in area needed, as footprint grows so does all the required infrastructure – concrete & connecting electrical – and Solar & Wind look less desirable.
Watts (vs Watt-hrs) used to simplify comparison –
NRC.gov Averages:
Monthly Consumption (kWh) 900kWh per household (range 650- 1200kWh)
For conventional generators, such as a coal plant, 1 megawatt of capacity will produce electricity that equates to about the same amount of electricity consumed by 400 to 900 homes in a year.
For renewable energy such as wind or solar, the equivalent is even less because they typically produce less energy than conventional generators since their fuel source is intermittent.
According to a Feb 22 2022 report from Energy Storage News, the power delivered is 62 megawatts, and does not need to be reduced down to the 20% efficiency of 12 to 15 megawatts.
But that 62 megawatt delivery comes from 118 megawatts of solar cells connected to a “68MW/275MWh” battery system. It’s at Edwards Air Base, which gets a lot more sun than San Jose CA.
I don’t remember if it is acceptable to post links here, so I will go without to play it safe.